

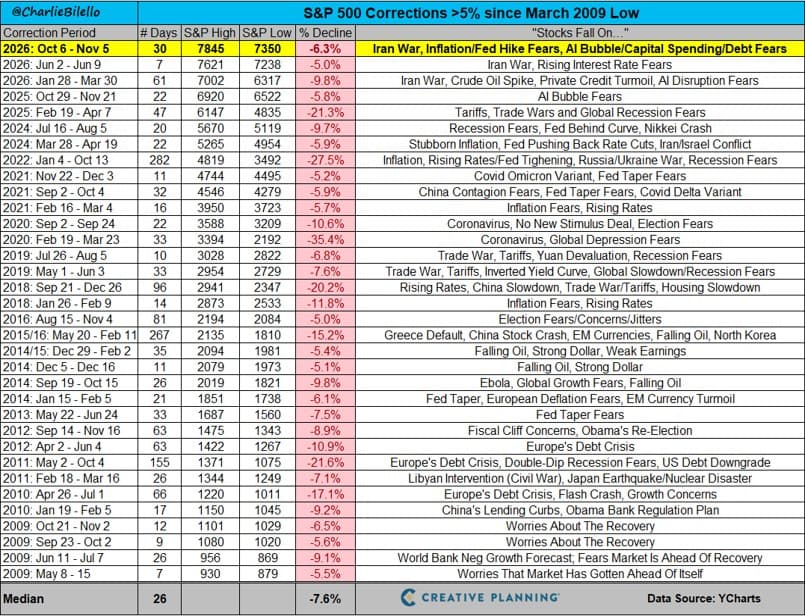
As shown in the chart through November 5, 2026, the S&P 500 has fallen 6.3% from its October 6 high of 7,845 to a low of 7,350, a slide of 30 days so far. That makes it the third decline of more than 5% this year and the 34th since the March 2009 low. Measured against the 33 episodes before it, this one is ordinary: the median decline on this list is 7.6% over 26 days. Whether it stays ordinary is a question the chart can’t answer.
The Headlines Change. The Declines Keep Coming.
The right-hand column is the part of this chart I find most useful. Every one of these 34 declines came with its own story about why this time was different: the Fed, oil, a debt downgrade, a virus, tariffs. This fall it’s the Iran war, inflation and rate hike fears, and worries about an AI bubble and the capital spending behind it.
The depth and speed have varied enormously. In early 2020, coronavirus fears took the index down 35.4% in 33 days. In 2022, inflation and rising interest rates produced a 27.5% decline that dragged on for 282 days. Most episodes were far milder, but none of them felt mild while they were happening. In every prior case, it felt like the end of the world — and in every prior case, the decline eventually ended, and the S&P 500 went on to a new all-time high.
A note on terminology: this chart counts any decline of more than 5% as a correction. In common usage, “correction” usually means a drop of roughly 10% from a recent high. By that stricter definition, just 10 of the 34 episodes here qualify, and even the current 6.3% decline doesn’t — at least not yet.
What 34 Past Declines Can’t Tell Us About This One
Here’s where the historical record stops being helpful. The chart shows how far each decline fell and how many days passed from high to low. It doesn’t show how long the market took to climb back to its prior high; that’s a different, often longer measurement that isn’t on this chart at all. So the 26-day median is the typical length of a decline, not a recovery timeline, and it’s not a forecast for this one.
Nor does the chart’s top row tell us the decline is over. November 5 is simply where the data stops. The question everyone wants answered, how deep this goes and how long it will take to recover, has no answer in advance.
That uncertainty isn’t a flaw in the data. It’s the reason stocks have historically carried a risk premium: investors expect to be compensated for bearing exactly this kind of unknown. Expectation isn’t a guarantee of realized returns, and the chart’s own 35.4% and 27.5% entries show how far a decline can run before the recovery arrives. The index figures also mask what’s happening underneath; an index returning to a high says nothing about any single stock doing the same.
What this chart can tell investors is that declines of this size are a routine feature of the stock market. What it can’t tell them is where this one stops. Those two facts belong together.
Hear Charlie walk through more charts in this week’s episode of The Week in Charts.
Creative Planning, LLC, provides investment advisory services and works in coordination with Creative Planning companies to deliver integrated tax, legal and insurance services as well as other financial services. This material is for informational purposes only and is not intended as investment, tax or legal advice. Past performance does not guarantee future results. Information contained herein is believed to be reliable but is not guaranteed.