

Through October 27, 2026, Apple and Nvidia are the only Magnificent Seven stocks outperforming the chart’s S&P 500 benchmark on a year-to-date total-return basis. Apple has returned 28.0% and Nvidia 17.1%, against 13.8% for the benchmark.
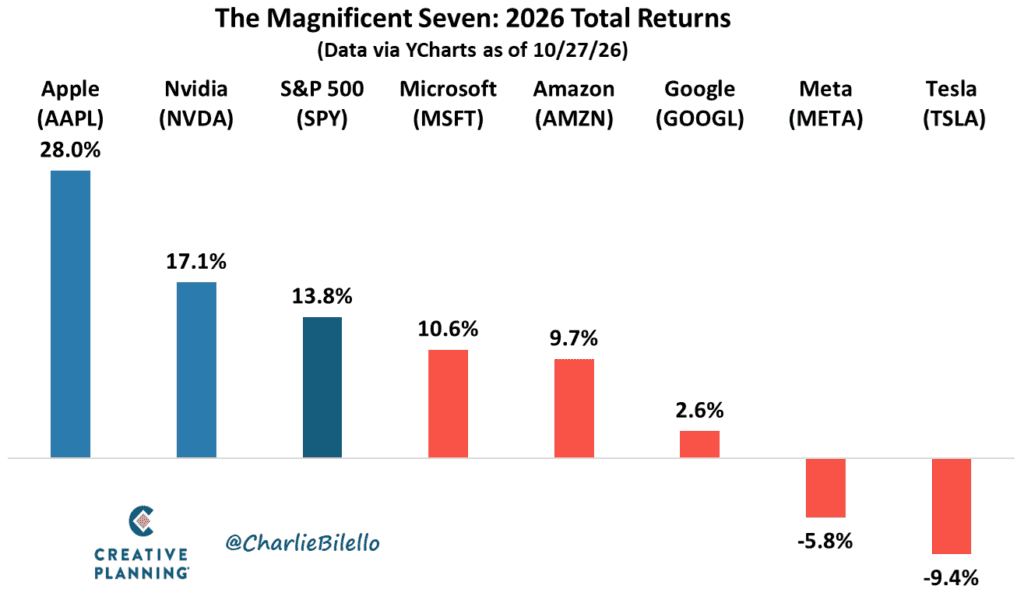
Source: Year-to-date total returns for the Magnificent Seven and the chart’s S&P 500 benchmark through October 27, 2026. Data via YCharts.
Microsoft (10.6%) and Amazon (9.7%) are positive but trail the benchmark, and Google (2.6%) is barely ahead of flat. Meta (−5.8%) and Tesla (−9.4%) are the only two with negative returns. Five of the seven are behind the benchmark, but underperforming is not the same as losing money. It’s also worth remembering that these seven companies are a small slice of the market, not a stand-in for it.
Why I Keep Coming Back to Free Cash Flow
Apple and Nvidia lead the group on another measure: they also rank first and second in free cash flow. Elsewhere in the group, heavy spending on AI infrastructure is putting pressure on cash flow.
Free cash flow is the cash a business generates from operations after paying for capital investments such as data centers, equipment and facilities. A company can produce strong operating cash and still show weak free cash flow if it’s investing heavily. That lower number reflects a spending choice, not necessarily a weakening business, and it says nothing on its own about whether those investments will pay off. Companies also define free cash flow in their own ways, which is why comparisons across companies require care. The SEC notes that non-GAAP figures must be reconciled to the closest GAAP measure, and leaves it to investors to decide how much weight to give them.
What The Chart Doesn’t Tell Us
The chart shows returns. It doesn’t show cash flow, capital spending or how any of these companies calculate their figures. I think the free-cash-flow connection is worth examining, but two stocks leading on both returns and cash generation in the same period doesn’t establish that one caused the other. The explanation also may not apply evenly across the group, and the data runs only through October 27, so these aren’t full-year results. I’ll keep following this in The Week in Charts.
Creative Planning, LLC, provides investment advisory services and works in coordination with Creative Planning companies to deliver integrated tax, legal and insurance services as well as other financial services. This material is for informational purposes only and is not intended as investment, tax or legal advice. Past performance does not guarantee future results. Information contained herein is believed to be reliable but is not guaranteed.