

")
The stock market has been on quite a run of late, and while many are celebrating each time the market hits a new high, those same new highs create anxiety for others.1
The US market gained 8% from election day through the end of 2016, and large US stocks added another 6% gain through the end of March. Let’s break down some of the factors that play into this.
First, there is a portion of the gain attributable to the “Trump Bump.” During the election campaign, President Trump promised to roll back costly regulations and pledged to reduce corporate taxes, which would not only positively impact future earnings but would also lower taxes on cash coming back into the US that many corporations have kept overseas to avoid the US corporate tax. If you lower the taxes of a corporation, even if the corporation does not increase revenues by a dollar or reduce expenses by a dollar, their profit will automatically go up, simply because taxes have been reduced. The market quickly priced in all of these changes, expecting Congress would go along with this plan. Despite a fight within his own party over healthcare reform, there is no indication President Trump will find opposition with his general theme of lowering corporate taxes. Because stock prices are always a reflection of anticipated future earnings, this allowed for a very quick pricing in of the tax savings. This is the largest reason for the “Trump Bump.”
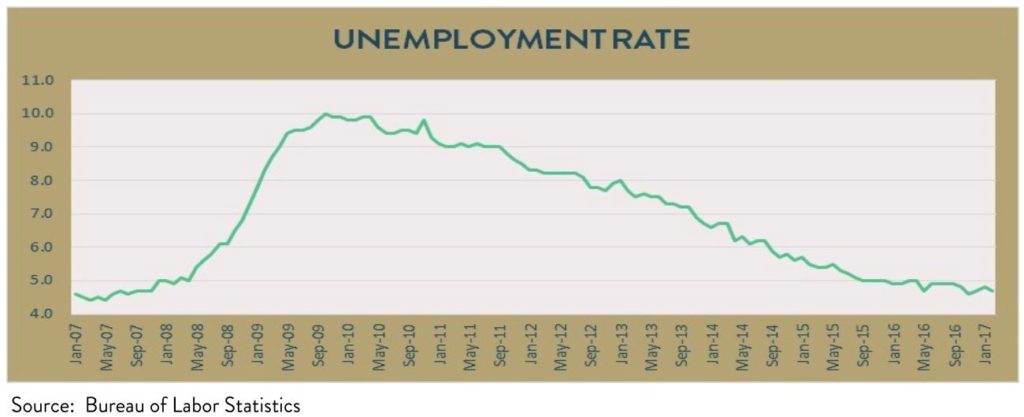
Independent of the Trump Presidency, unemployment declined from nearly 10% when President Obama took office to 4.8% the week President Trump took office. 4.8% happens to be the approximate point at which the Federal Reserve considers the workforce “fully employed.” This is considered an extremely bullish indicator, as at full employment, recovery tends to finally reach the middle class.
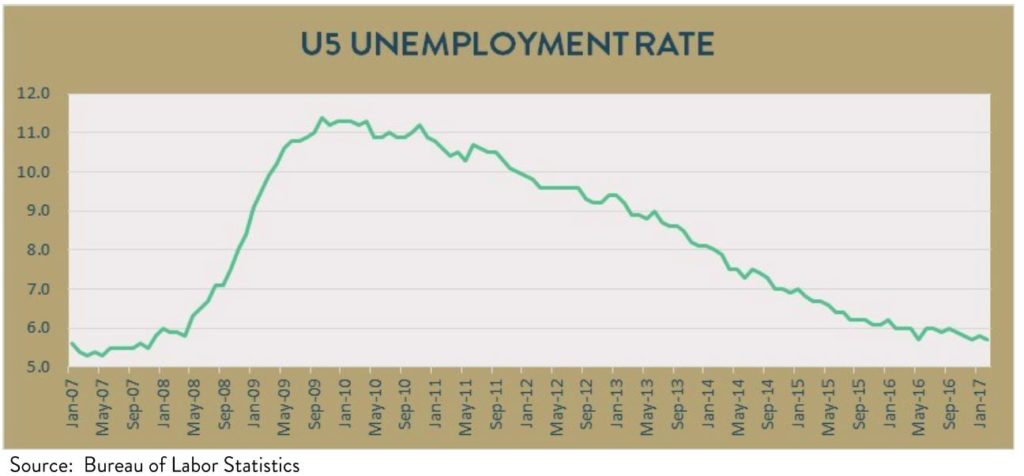
For those that are rolling their eyes at the former graph and prefer the much broader view of unemployment, the U-5 unemployment rate is similar to the traditional unemployment rate, but also includes those people who have stopped working because they believe that, due to economic conditions, no work is available to them, as well as people who would like to and are able to work, but haven’t looked for work recently. The addition of these different types of unemployed people increases the unemployment rate, but the main theme here is that the U-5 rate follows the same trend as the traditional unemployment rate, with the current rate the same as it was prior to the 2007—2008 economic crisis. Or, simply put, it is much better than it has been in nearly a decade, and heading in the right direction.
At first, when the economy is struggling, the Federal Reserve will often lower interest rates to encourage spending. Although fiscal conservatives and fiscal liberals disagree on the hangover effects, all agree that when interest rates drop, it becomes easier for people to buy real estate (with lower rates, you can of course pay more for a home or investment property), stock prices inflate (interest costs for corporations go down, positively impacting net revenue and there is cheap money to borrow for expansion), small business owners are able to borrow at a lower rate and hire more employees, and it becomes easier to make major purchases, such as cars. The issue is at the beginning of a cycle, the lower rates tend to benefit mainly the wealthy. 62% of Americans own real estate, including a home, and just 52% of Americans have an investment portfolio.2 The reduction in interest rates, combined with many other things, finally resulted in unemployment dropping to 4.8% as of election day.
At this level, the lower interest rates finally seem to benefit the middle and lower classes. The reason is at full employment, a business owner who wants to hire an employee usually hires that employee from another company, rather than off the unemployment line. To do this, the business owner will usually need to pay that employee more than they are presently earning. This creates wage inflation. When you finally have wage inflation, then nearly everyone begins to benefit from the recovery.
The Federal Reserve had to lower rates from the crisis to 2016 to continue to attempt to invigorate a slow growing economy. However, when the unemployment rate hit full employment, the Federal Reserve began to accelerate their campaign of raising interest rates, and has done so a few times.
After the election, job creation continued, with the unemployment rate dropping down to 4.5% as of the date of this letter.3 In February, nonfarm payrolls increased by 235,000, making it the 85th straight month of private sector job growth, the longest streak in history. The stock market likes a strong economy; it likes knowing that consumers are going to buy goods and services from corporations. It also likes knowing that corporations can raise their prices because consumers are able to spend more given increasing personal earnings. This provides a backdrop for a strong market outlook.
Now what does this mean for stock prices? While the market is up 5.9% as of the date of this letter, the forward P/E ratio as of this writing is approximately 17.5.4 The stock market historically trades in a P/E range of around 16, so while we are on the higher side of historical valuations, this is far from being classified as a bubble. By way of comparison, during the tech bubble, P/E ratios were well over 30, and some over 100. In addition to the current P/E ratio being below bubble territory, stock P/E ratios cannot be looked at in a vacuum as if nothing else matters. P/E ratios need to be compared to bond yields. Yes, the historical average P/E ratio for the stock market is 16, but the historical average yield for the 10-year Treasury, a “risk free” investment, is 4.5%. Today, we have a forward P/E ratio of around 17.5, but a yield on the 10-year Treasury of just 2.5%. Historically, there has been a much smaller reward for investing in stocks because getting 4.5%, risk free, sounds pretty good. Today, the attractive alternative of earning a risk free return of 4.5% simply does not exist. From this perspective, one could argue that stocks are undervalued.
Regardless, it is important to note three things. First, stock prices are in the range of historical norms. Second, stock prices may even be considered low relative to bond yield alternatives. Third, and more importantly, valuations of stock prices that are anywhere remotely near historical norms are not indicative of future performance.
It is widely assumed that when stocks are overvalued, they must come down in price. What we do know is when stock prices are at these valuation levels, the stock market has a positive return the following 12 months approximately 75% of the time.
Finally, it is important to note that while the US market is not overvalued, it certainly is fairly valued or fully valued. There are bargains to be found, however. International stocks continue to trade below their historical norms, as do Emerging Market stocks. So far this year, both have outperformed US stocks. Before you rush to sell all of your US stocks and send your money overseas, note that while the gap between US and International stocks always closes, they can remain disparate for years. For this reason, we allocate assets to various markets. One only needs to look at the last two years to find examples of international stocks starting the year ahead, only to fall behind by year end.
Whether you think the market will go up or down from this point in time, know that you’re right.5 For those of you that are fearful that the markets have gone too far, too fast, and that we are due for a correction, know that you’re right. However, you may not be right for the reasons you think you are. You’re right because corrections happen all the time. On average, in every single calendar year, the market falls approximately 14%. From these levels, that means the market would drop more than 3,000 points. If and when that happens, will you be ready to seize the opportunity and become a buyer while stocks are on sale, as we did in January and February 2016, or will you lose sleep and worry yourself unnecessarily?
For those of you, on the other hand, expecting the market to continue to advance, know that you are also right, because that is what the market always does. While we have had dozens of corrections and bear markets over the years, the economy has somehow managed to move on to new highs, regardless of who was president and regardless of what was going on in the world. The stock market does not go up and down, it goes up, with intermediate breaks. Sometimes those breaks last for days, sometimes weeks, sometimes months, and every now and then even a few years. The winner anticipates and prepares for both. They prepare for winning over the long run by staying engaged in the markets, a strategy that rewards the long-term investor, and they win as well by being prepared to take advantage of corrections by adding to quality positions while they are on sale.
There are always nervous “investors” concerned the market is too cold,6 and there are always “investors” concerned the market is too hot.7 For your friend waiting for the “just right” Goldilocks moment to invest, you can let them in on a secret: the market is never “just right” and those that try to time it almost always find themselves permanently wrong.
Footnotes
- Interestingly, the folks that are anxious about a market run-up are the same ones who are anxious when the stock market goes down. Either way, they can’t seem to have any fun.
- I know, alarming right?
- President Trump called 5% unemployment “ridiculous” and a “fake” number during the election, but has since enthusiastically supported the 4.5% number as reflective of the economy’s enthusiasm for his economic policies.
- A Stock’s P/E ratio is the ratio of the stock’s market value per share to the company’s earnings per share. For example, if a company has $100 million in earnings and 100 million shares outstanding, the earnings per share is $1. If the stock price of that company is currently $25, that stock’s P/E ratio is 25.
- How is that for bringing us all together again!
- And they can always find reinforcement somewhere in the financial media.
- You don’t have to search too far for financial stories promising impending doom.